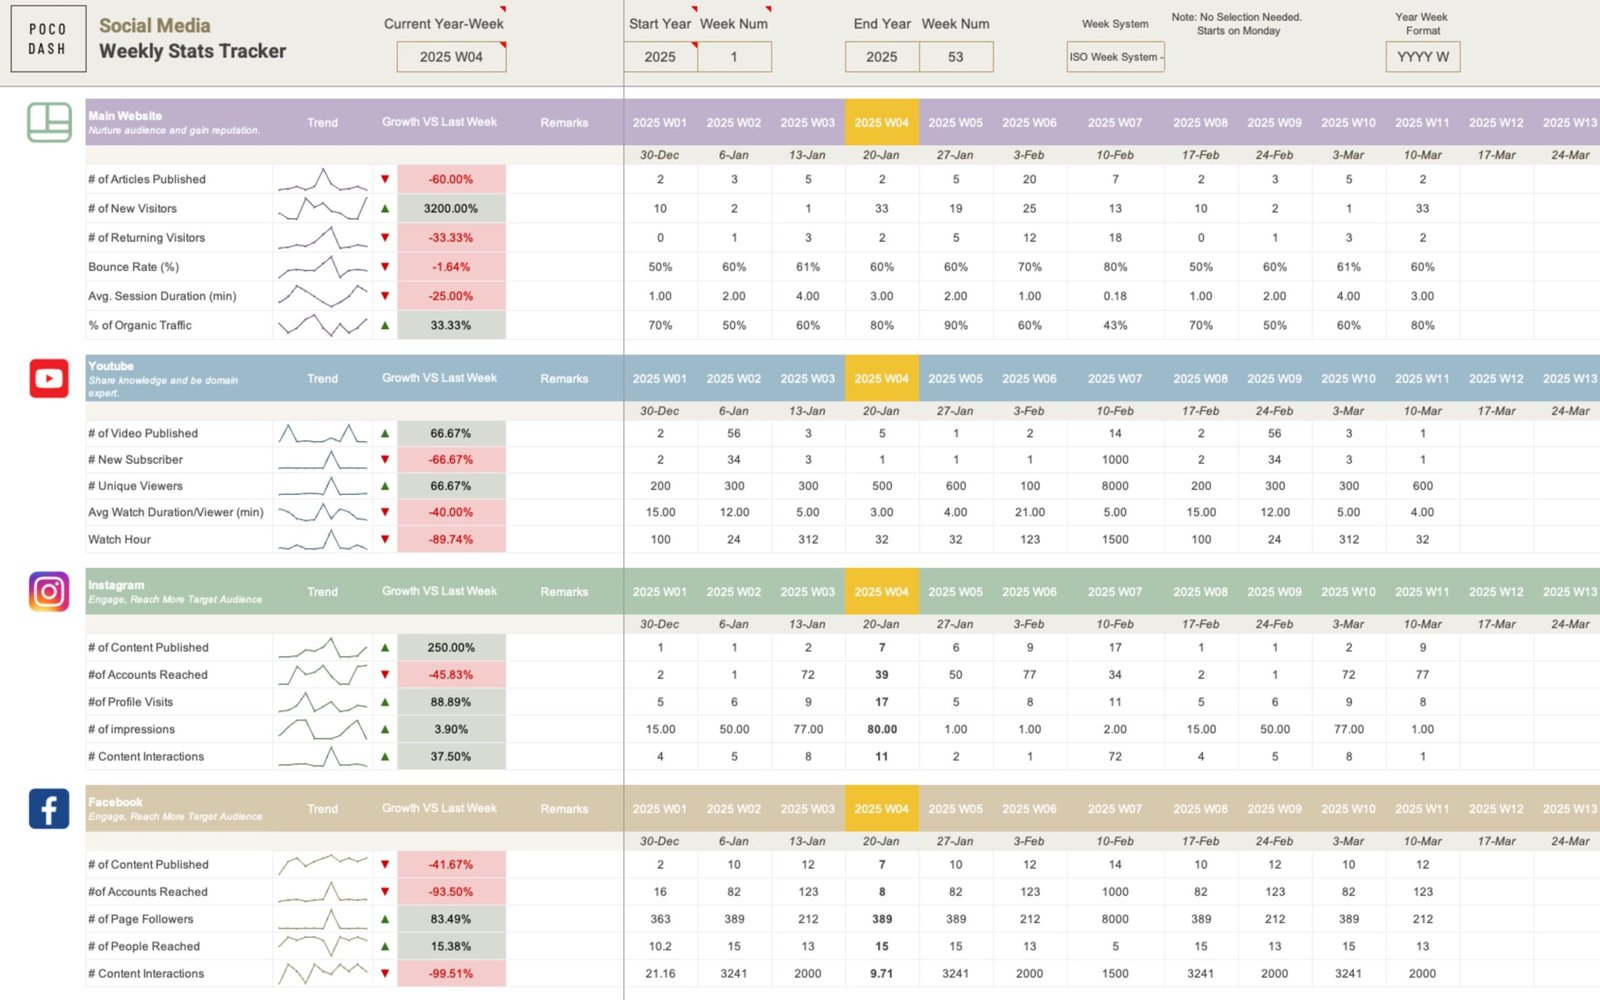
Social Media Weekly Stats Tracker is perfect for social media managers, marketing agencies, and businesses relies on social media strategy to keep track of all the platforms KPIs in one easy-to-use spreadsheets. You will find clear instructions below to guide you through the process.
How to Use Social Media Weekly Stats Tracker
Both the Google Sheets and Excel versions follow the same steps, so you can use the guide below for either product.
User Guide for Social Media Weekly Tracker
Welcome! 👋 This quick reference will help you set up and use your weekly tracker to keep track of your social media metrics and calculate weekly growth rates. Let’s get started!
Step 1: Setup Year-Week Range
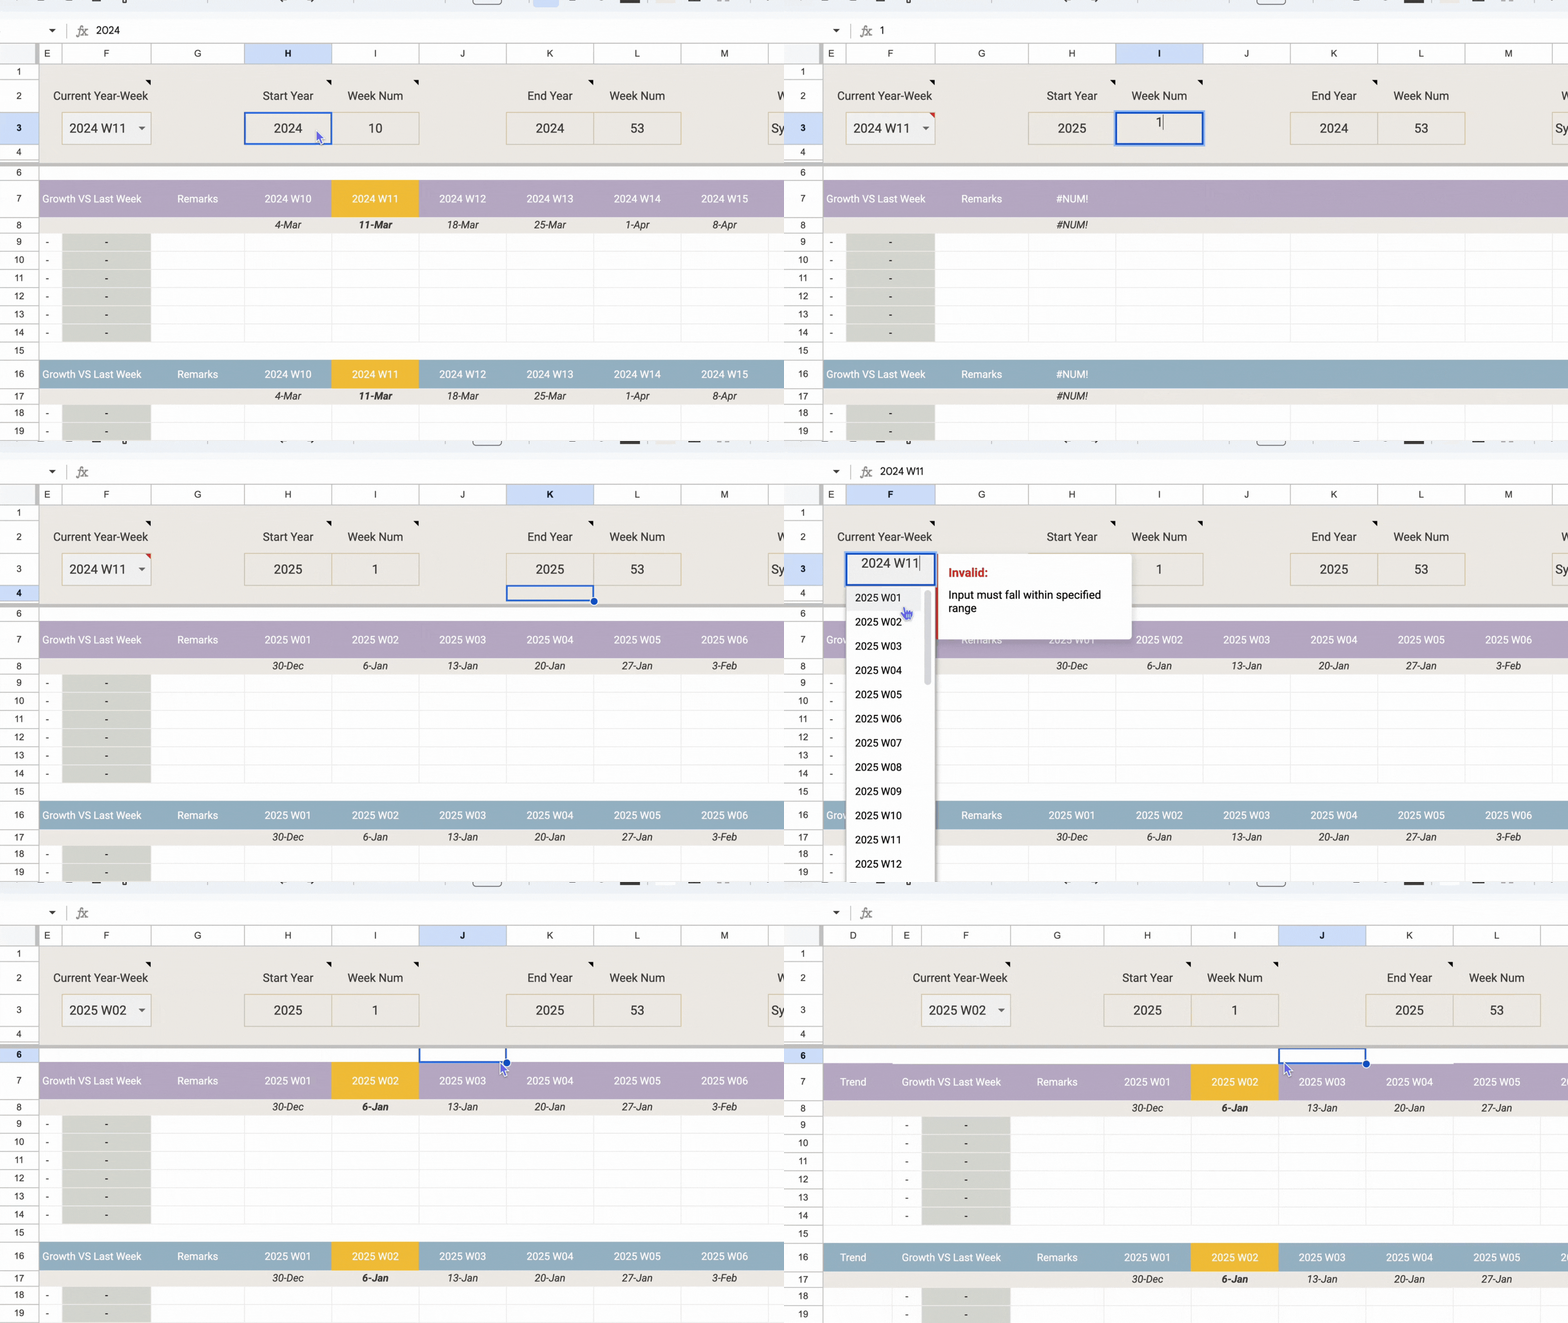
▶ Enter the Start Year and Start Week Number to define when your tracking begins. ▶ Enter the End Year and End Week Number to define when your tracking ends. This will generate year-week headers for all social media platforms.

Step 2: Select Week System
Select your desired week system from the dropdown. 2 Week System options available: (1) System 1: ISO Week – The first week of the year includes the first Thursday and always starts on a Monday. (2) System 2: Custom – The first week of the year includes January 1, and you can choose which day the week starts.
Based on the selected week system, the start dates for every week would be auto-populated under the Year-Week labels. You can choose to hide the start dates or show them.
Step 3: Edit Platform, Metrics Name
With our tracker, you’re able to edit the platform names and metrics names easily. 1) Edit Metrics: Simply override the existing metrics.
2) Remove Metrics: Select the entire row and delete.
3) Add Metrics. Select any of the metric row under the same section, right click and enter a new row. Copy the formulas down to the newly-added row.
Step 4: Start Tracking
Now you can start tracking KPI. Simply enter a number for the metrics.
Step 5: Calculate Weekly Growth Rates
The Growth vs Last Week column calculates percentage changes using the “Current Year-Week” dropdown. For example, if “2025 W02” is selected as the current year-week, the growth rate compares metrics between “2025 W01” and “2025 W02.” This feature allows for dynamic calculations based on the week you’ve selected.
Step 6: Visualize Weekly Trends
For each KPI, the tracker displays weekly trends in minimal line charts, enabling easy monitoring and analysis of performance over time.
Step 7: Add Commentary
Leave notes in the “Remarks” field as you analyze performance. This provides context for social media metrics and helps inform timely actions to improve results.
Happy Tracking!
